Workspace: Value history
Task description
The Value history shows the values that Quantities go through in a series of selected states. The Value histories are shown per Quantity.
Task context
The Value history can be accessed from the Simulation environment. Simulate scenario
Tasks in this workspace
The Value history can be created for one or multiple states. These states do not necessarely have to be together in a path, but it would be insightful to select states that are connected in the state-graph to say something about the value changes of the Quantities. Use the draw task to create the Value history.
Sort: By entity | By quantitySelect: All | None
Draw: History
Clear: Screen
Save: Diagram to EPS file
- Additional features
- Tooltips | Action buttons
- Definitions involved ingredients
- Quantity | Simulation | State-graph | Value | Value history
- Icons
- Icons related to this task
- Related tasks
- Other simulation inspection tasks: View entities, configurations and attributes | View quantity values | View model fragments | View dependencies | View transition history | View equation history
Example
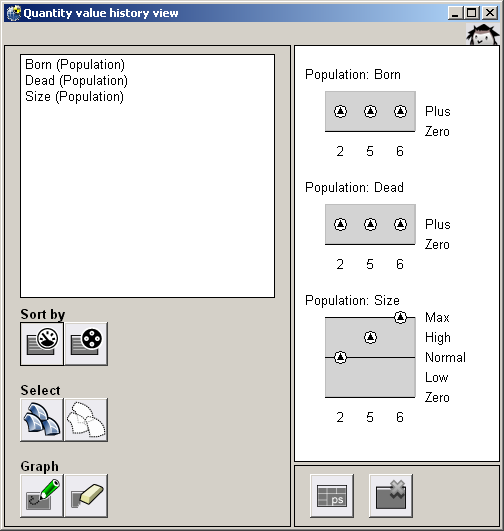
The value history shows the magnitude and derivative information for a set of quantities for a specific behavioural path.