Workspace: Equation history
Task description
In the Equation history a diagram of inequality values in each state for each quantity can be shown. This can help in understanding the simulation.
Task context
The Equation history can be accessed from the Simulation environment.
Tasks in this workspace
The equation history provides several tasks to allow different views on the equations in the simulations. To create an Equation history, select the desired equalitions in the list on the left. Then use the Draw task to create the diagram.
Display: Derivative equations | Legacy mode | Long names | Short namesSelect: All | None
Draw: History
Clear: Screen
Save: Diagram to EPS file
- Additional features
- Tooltips | Action buttons | Graphical icons
- Definitions involved ingredients
- Equation history | Inequality | Quantity
- Icons
- Icons related to this task
- Related tasks
- Other simulation inspection tasks : View entities, configurations and attributes | View quantity values | View model fragments | View dependencies | View transition history | View value history
Example
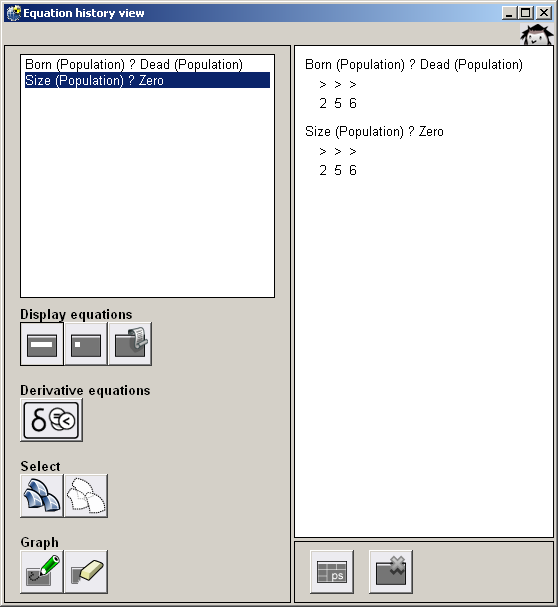
The equation history screen shows the inequalities changes for a specific behavioural path.